DIAGNOSIS OF A PRODUCTION SYSTEM
- Rui Marques
- May 7, 2024
- 10 min read
Updated: Jul 16, 2024
SUMMARY
In this article we describe how to carry out a comprehensive diagnosis of a production system, aligned with the Lean principles, aiming at generating an improvement plan with a real impact on the company's results.
INTRODUCTION
For a long time, efforts have been made to carry out quantified analysis of production systems, aiming at improving them.
For this purpose, several tools have been used that have often given a limited view of the processes.
It is important to have a more complete view of the value chain, including customers, suppliers, material flows, information flow and, obviously, processes. The following approach will give us this broader view.

Figure 1: Schematic representation of a value chain
ANALYSIS OF DEMAND
It all starts with the customer. The diagnosis must therefore begin with an analysis of how the customer consumes the manufactured products, so that we can then assess the extent to which the production system is aligned with demand.
ABC/XYZ Analysis
ABC analysis, related to the Pareto principle, has long been used for sales, inventory, and production management. According to this principle, we must concentrate our efforts on the few items that represent the largest sales volume.
The ABC dimension has to do with the volume of customer demand. According to this dimension, high volume products (typically representing 80% of sales) are classified as A, intermediate volume products (between 80 and 95% of sales) are designated B and low volume products are classified as C. ABC analysis can also be done based on sales value.
The ABC dimension is, however, not sufficient for correct management, as it does not consider uncertainty, which is addressed in the XYZ dimension.
The XYZ dimension is related to the frequency with which the customer consumes the products we manufacture. According to this dimension, products are classified as X (regular and more predictable consumption), Y (intermediate consumption periodicity) or Z (very irregular and unpredictable consumption).

Figure 2: Example of ABC/XYZ analysis
Takt Time Calculation
Knowing customer demand, we must calculate Takt Time. Takt represents the rate at which the customer consumes the products manufactured by the supplier. It is a cycle time, expressed in units of time elapsed between consecutive units consumed.
It is calculated by dividing the company's net production time by the quantity consumed in the same period, according to the following formula:

Figure 3: Takt time calculation
Takt Time will help us, in this phase, to assess the extent to which the production system is or is not synchronized with demand, and whether the different processes that make it up are synchronized with each other.
Delivery time
Then, knowing the delivery time expected by the customer we can relate it to the lead time of the production process.

Figure 4: Representation of the relationship between Lead-time and expected Delivery Time
The relationship between the process lead-time and the delivery time expected by the customer will define the pull model to be adopted.
FLOW OF MATERIALS AND INFORMATION
Material Flow
After analyzing demand, we will map the flow of materials, from shipping finished products to customer to receiving raw materials from suppliers.
The goal of this mapping is to identify and quantify the different states (transport, inventory, control, transformation) in which materials are found throughout the production chain and, fundamentally, to identify all waste (operations that do not add value).
Information Flow
In parallel with the material flow, we will map the corresponding information flow (planning, scheduling, and control), that is, how information relating to customer’s needs is processed and sent to production processes. We will also look at how the necessary information is sent to suppliers of raw materials and components.
We will also check whether this flow of information faithfully reflects customer demand.
To represent these flows, we’ll use Value Stream Mapping (VSM), which has its origins in Toyota's MIFA (Materials and Information Flow Analysis).
VSM is nothing more than a graphical depiction of a value chain showing customer and demand data on the right, suppliers and supply data on the left, the entire flow of information at the top, the flow of materials and key process data in the center and lead-time data (resulting from converting inventory into time) at the bottom.

Figure 5: Example of VSM of the current state
PRODUCTION PROCESSES
The mapping of material and information flows will be complemented with an analysis of the different production processes involved.
Equipment Reliability
Is production equipment available and able to produce, when necessary, quality products in the required quantity?
The appropriate indicator to answer this question is OEE Overall Equipment Effectiveness and which results from multiplying Availability by Performance and by Quality. An OEE below 80 to 85% (depending on the process) will mean there is a clear improvement opportunity.

Figure 6: OEE calculation
Variation and Process Robustness
Variation is present in any process. This variation may be due to common causes (inherent to the process itself) or to special causes (process disturbances). How do the processes vary? Are processes under statistical control?

Figure 7: Example of a process control chart
Taking variation into account, what is the Process Capability, i.e., is the process capable of consistently producing products within customer specifications?

Figure 8: Relationship between Specification Limits and Process Variation
Process Flexibility
An important aspect to look at is Flexibility of the processes in terms of variety: if different part numbers need to be produced on the same equipment, is it capable of moving from one part number to another in a short time?
The “changeover time” indicator measures the time elapsed between the last unit produced in the previous run and the first unit (compliant and produced at the nominal rate) in the new production run.

Figure 9: Changeover time
It is important to identify any constraints that prevent the process from producing any part number that the customer requests, in the exact sequence in which it is requested.
Another aspect to be analyzed is flexibility in relation to volume: in case demand volumes vary, do processes adjust easily, showing constant levels of efficiency, regardless of volume?
Manual Processes
Manual processes (or those that combine manual and machine operations) must also be analyzed in terms of labor efficiency. What proportion of time is spent adding value and what proportion is spent on non-value-added tasks?
Operators are usually busy adding value, loading, unloading, controlling, moving and waiting/idling.
A very useful tool in this analysis is the so-called Spaghetti Diagram, which graphically depicts the operator's motions at work.

Figure 10: Example of a Spaghetti Chart
As well as identifying and quantifying any non-value-added tasks people perform, we will look closely at variation present in manual tasks, which is often related to the lack of standard work.
And we will assess people’s training and versatility, i.e. (from a Lean perspective), their ability to operate different processes, as shown in the multi-skills matrix below:

Figure 11: Example of a multi-skills matrix
IDENTIFYING IMPROVEMENT OPPORTUNITIES
Once all the relevant data has been collected and added to the VSM, we will identify the different opportunities for improvement that the current system presents. These improvement opportunities must be seen from a “system” perspective, with a real impact on the value chain.

Figure 12: Current state VSM showing improvement opportunities
We can also use a benchmarking tool to assess the extent to which our production system is aligned with best practices, obviously considering the specificity of the company.

Figure 13: Extract from a benchmarking matrix showing current state
At this point, we will have a clear vision of the current state of our production system and its potential for improvement, which we can share with our teams.
DEVELOPING THE FUTURE VISION
We will then develop a vision of the future state of our production system, which allows us to efficiently satisfy customer demand.
To do this, we will apply the following principles, which will be described below:
Have Value in mind
Eliminate non-value-added activities
Build reliable and robust processes
Make processes flexible
Create continuous flow
Implement pull
Have Value in mind
Before redesigning or improving the production system, you must know exactly what the customer expects in terms of quality and service.
This knowledge is essential, as it is important that production processes deliver the required quality, without, however, incurring excessive costs due to excess quality, i.e., quality that the customer does not value and is not willing to pay for.
Eliminate non-value-added activities
Mapping and analyzing the current state of the production system has enabled us to identify and quantify the activities with no added value (waste, in the Lean philosophy) that should be eliminated as far as possible.
In the Toyota Production System the following categories of waste were identified:
Overproduction
Inventory
Transport
Waiting
Motion
Overprocessing
Defects
The team responsible for this work must be trained in observing and identifying theses wastes so that they can be eliminated in the future vision that is being developed.
Build reliable and robust processes
Manufacturing processes must be reliable, capable, and available to deliver products within customer specifications, in the exact quantities required, whenever needed. In the case of more complex process steps, it may be necessary to use more advanced statistical techniques to find the best combination of critical parameters.
Therefore, the equipment must be robust, compact, simple, suitable for the function, easy to operate and maintain, with good MTBF and MTTR levels.
Operators, duly trained in accordance with the TWI model, must produce in accordance with the defined Standardized Work.
Make processes flexible
Manufacturing processes must be flexible in two respects, namely variety and variation in demand.
With regard to the former, it is important that processes are capable of producing any part number that the customer requests, in the exact sequence in which it is requested, with maximum efficiency. The SMED method of reducing changeover times is the tool of choice for improving process flexibility.
As far as the second is concerned, it’s a question of having processes that adjust easily and quickly to any variations in demand, with constant levels of efficiency, regardless of volume. This means equipment whose cycle time may vary, multi-skilled teams of varying size, and standard work that takes into account different levels of demand, in line with the Shojinka concept.
Create continuous flow
The different stages or operations that make up the value chain should be arranged in the exact sequence of the process, so that materials can move seamlessly from stage to stage, with minimal transport and without intermediate inventory being built up.
Unless technical or technological constraints prevent it, this flow must be unitary, i.e. it must be done piece by piece, in batch size = 1.
This continuous flow facilitates management, reduces lead-time and optimizes labor utilization.
Operations should be integrated as much as possible. Examples include integrating pre-assemblies into main assembly, integrating packaging into assembly, integrating machining operations into casting, etc.
Implement pull
Production must be triggered by demand and synchronized with it.
Pull flow (production driven by demand) requires production to be levelled out beforehand, both in terms of volume and mix.
This pull flow concept implies that information from the customer about what needs to be produced is only sent to one point in the value chain (the regulating process), with the other processes interconnected by simple systems that ensure synchronization between them.
There are several types of pull flow system, depending on the type of demand, product complexity, lead-time required, process reliability, etc.
FUTURE STATE MAP
The future vision of the production system, developed in accordance with the above principles, will be represented in a future state map (VSM). This vision must obviously take into account customer demand and the specificity of products and production processes.
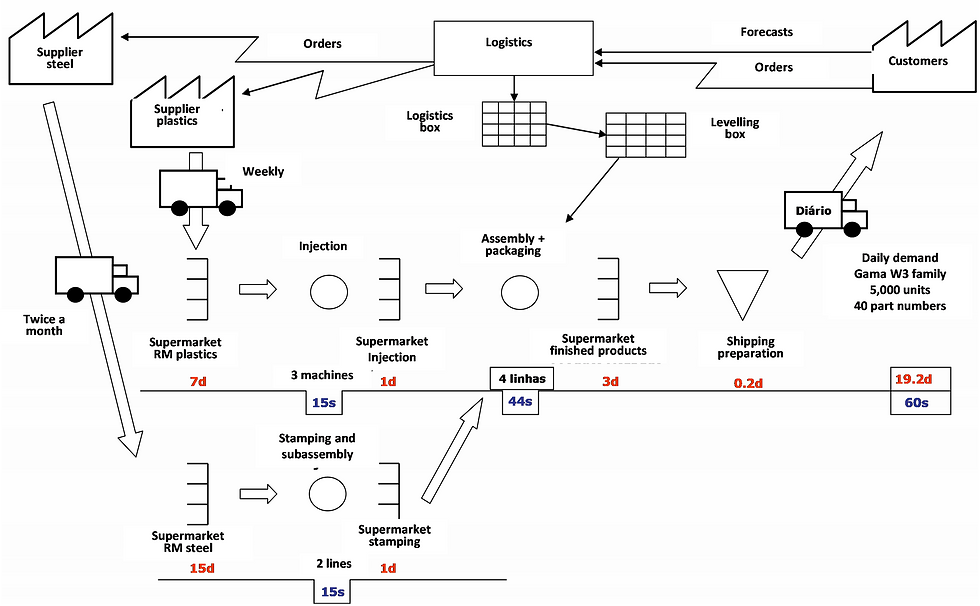
Figure 14: Example of future state VSM
In developing this future vision, it may be useful to go back to the benchmarking tool to check whether our vision is aligned with the best concepts applicable.

Figure 15: Extract from a benchmarking matrix showing current state and future state
IDENTIFICATION OF REQUIRED IMPROVEMENT ACTIVITIES
Once the future vision of the production system has been developed, as shown in the future state VSM, which is aligned with Lean principles and concepts, we will identify the improvement actions needed to implement the future vision.
We should initially identify high level macro actions and then define concrete actions that can form part of an implementation plan.

Figure 16: Example of future state VSM, with high-level improvement actions
These actions, depending on the subject, complexity and resources required, can take the following forms:
One-off actions
Workshops
Projects
Whatever their type, they must share the following characteristics:
Have a well-defined scope
Be measurable
Have a clear objective
Be easy to manage
Each action must be properly defined and documented so that their implementation can be easily monitored, as we will see below.
The A3 Report format is suitable for this purpose.

Figure 17: Example of A3 Report
ACTION PLAN
Once we have identified the various actions needed to achieve the defined future vision, we will build the respective implementation plan.
To do this, we will have to define the correct sequence of the different activities, considering their duration, the logic of implementation, and the existence of any interdependencies.
The plan must include the following:
Identification of each action
The objective (measurable, through at least one indicator)
The person responsible for the action
The team (if applicable)
Duration and estimated start and end dates
The plan may also include any resources (materials or otherwise) deemed necessary.

Figure 18: Example of an implementation plan
IMPLEMENTATION CONTROL
In parallel with drawing up the plan to implement the future vision, the corresponding control mechanism must be defined.
A frequency will be set (fortnightly or monthly) for short formal implementation follow-up sessions, attended by the company management team and the teams responsible for implementation.
These sessions will take place in an appropriate space which, in Lean vocabulary, is called Obeya (a Japanese word literally translated as “big room”) or War Room.
In addition to the company’s management indicators, this dedicated space will also display the current and future VSM, layouts, complementary information, the implementation plan, A3 reports for the different actions, as well as indicators relating to implementation, among others.
According to the defined frequency, those responsible for each of the improvement actions (possibly accompanied by members of their teams), and using the A3 reports, will make a brief presentation to the company's management on the progress of the actions, the results achieved, any difficulties and deviations. On this occasion decisions will be taken, if necessary, regarding each of the actions and the project in general.
As usual, the dynamic reality of companies and markets can make improvement plans obsolete if they are considered immutable.
An exercise should therefore be carried out annually to update the future vision and, of course, the respective implementation plan.
IN SUMMARY
We have presented how to carry out a comprehensive diagnosis of a production system, aligned with Lean principles, to generate an improvement plan with a real impact on the company's profit and loss account.
For a correct diagnosis, it is important to have a complete view of the value chain, including customers, suppliers, material flows, information flow and, of course, processes.
The starting point is an analysis of demand and a quantified description of the current state expressed in a VSM, possibly complemented by a benchmarking exercise.
The identification of improvement opportunities, from a value chain perspective, introduces the next stage of developing a quantified vision of the future state of the production system, in accordance with Lean principles. Underlying this vision is a transformation of the production system, materialized in an integrated and coherent action plan, which will be monitored and adjusted dynamically using appropriate systems. The transformation process should be continued by the review and execution of this kind of diagnosis, in order to implement a consistent continuous improvement culture.
REFERENCES
Mike Rother, John Shook
“Learning to see”
Lean Enterprise Institute, 1999
ISBN-10: 0966784308
ISBN-13: 978-0966784305
Comments